Tag Archives: ESXi troubleshooting

Stress Testing an ESXi Host – CPU and MCE Debugging

I have needed to stress test a component inside a physical server – this time it was CPU and I’d like to share my method here. I have done a Memory Stress Test using a Windows VM in a previous article. I will be using a Windows VM again, but this time it will be Windows  Server 2012 Standard Edition that can handle up to 4TB Memory and up to 64 Sockets containing 640 logical processors – a very nice bump from Windows Server 2008 R2 Standard that had a Compute configuration maximum of 4 sockets and 32 GB RAM.

The host has crashed several times into a PSOD with Uncorrectable Machine Check Errors. From the start I had a hunch that the second Physical CPU or a System Board are faulty – but these were replaced already and the host has crashed yet again. I have taken a closer look at the matter and went to stress thest this ill host’s CPUs. Continue reading

PSOD caused by LINT1 Motherboard Interrupt

One night we had a situation on our remote site that was running ESX 4.1.0 on a DELL PowerEdge T710 Server. It went to PSOD and then the RAID controller stated that it was unable  to boot. The screen captures we got were:

purple%20screen

And after a reboot, an unwelcoming screen was shown:

Fortunately, after another reboot the system booted just fine, however it was pretty obvious that the hardware itself was in a pretty unstable state. On iDRAC, we have discovered that we got a critical warning on a component (unfortunately it was late at night and I didn’t think about screenshotting that) with Bus IDs 03:0:0. Listing components via lspci revealed that the following component was sitting on the given ID:

03:00.0 RAID bus controller: LSI Logic / Symbios Logic MegaRAID SAS GEN2 Controller (rev 05)

 Even if it was straightforward from the get-go which component might have been failing, it was double-confirmed by the very useful lspci command.

ESXi Boot Loop on Dell PowerEdge R720

We have faced quite a strange issue with one of our Dell PowerEdge servers on a remote site. When the branded image was deployed on the host, we kept getting bootloops. The system has just started unloading modules after they were seemingly loaded. After inspecting the vmkernel log at boot-time by pressing ALT-F11, I have noticed a few strange warnings:

2014-11-24T04:13:50.237Z cpu2:2631)WARNING: ScsiScan: 1485: Failed to add path vmhba1:C0:T0:L0 : Not found
2014-11-24T04:15:08.990Z cpu7:2792)WARNING: ScsiScan: 1485: Failed to add path vmhba1:C0:T0:L0 : Not found

I have poked around the settings in BIOS to find out what could have been causing the issue that were seemingly coming from the RAID controller itself. I have changed the SATA to report as RAID opposed to AHCI which was set previously, and the next boot was successful.

This didn’t have any effect on already present drives or data because the only device that used the on-board storage controller was the DVD-ROM.

1GbE Intel NIC Throttled to 100Mbit By SmartSpeed

We had a case on one of our ESXi hosts equipped with an Intel Corporation 82571EB Gigabit Ethernet Controller – although it was 1Gbit in speed, we were unable to achieve autonegotiation higher than 100 Mbit. When setting it manually to 1Gbit, the NIC disconnected itself from the network. Every other setting worked – 10 Mbit and 100Mbit both half and full duplex. We tried investigating with our Network Team, forcing 1Gbit on switch and that has also brought the NIC down.

I delved deeper into this issue and observed the VMkernel log via tail -f when I have forcibly disconnected the NIC and reconnected it again via esxcli. One line appeared that caught my attention:

vmnic6 NIC Link is Up 100 Mbps Full Duplex, Flow Control: None
e1000e 0000:07:00.0: vmnic6: Link Speed was downgraded by SmartSpeed
e1000e 0000:07:00.0: vmnic6: 10/100 speed: disabling TSO

I immediately caugt up on SmartSpeed and tried to find a way to disable it – that is until I have found out on many discussion threads later that SmartSpeed is an intelligent throtlling mechanism that is supposed to keep the connection running on various link speeds when an error somewhere on the link path is detected. The switches were working okay, the NIC didn’t detect any errors, so the next thing to be checked would be the cabling.

I arranged a cable check with the Data Center operators and what do you know – replacing cables for brand new ones eventually solved the issue! Sometimes the failing component causing you a headache for a good few hours can be a “mundane” piece of equipment such as patch cables.

PSOD Caused by a Machine Check Error (MCE)

Today I’d like to present to you an ESXi host crash we had in our environment tha was due to a hardware failure. This time, we were “lucky” enough to capture its PSOD. In earlier article about Machine Check Errors, I was talking about what exactly do they mean and how to debug them. Also, most of the time, when these are correctable Machine Check Errors, the host only reboots itself without leaving any trace as of why. That I have investigated by determining faulty memory after running a custom memory stress test on an ESXi host.

The Uncorrectable Machine Check Exception presented below is caused by “Other TransBus Generic Error” – this could have been related either to a CPU, or pathways on the motherboard… or both. Most of VMkernel dumps was pointing out to 2nd Physical CPU, but there were some occurrences on 1st CPU as well. Even the AHS log from the HP blade server was corrupted each time I tried to send it to a technician. Therefore they took action and replaced both the motherboard and CPUs. Since then there were no more trouble with this host.

PSOD due to Uncorrectable MCE on CPU

Manual Debugging:

For those of you who are interested – the MCE codes reported were:

In iLO: FA001E8000020E0F
in vmkernel.log: c800008000310e0f ; 8800004000310e0f

Now, if we decode the message we got from iLO manually (so that we have another source of MCE to decode from):

1 1 1 1 1 0 1 0 0 00 0000000011110100 0 0000 0000000000000010 0000 1110 0000 1111

UC 1
PCC 1
S 0
AR 0

Signaling:
Uncorrected error (UC). RESET THE SYSTEM

Examples? None found.

Compound error code found: Bus and Interconnect Errors.

BUS LL PP RRRR II T
BUS{11}_{11}_{0000}_{11}_{0}_ERR

Level: 11, generic
Request: 0000, Generic

Bus & Interconnect mnemonics:
Participation: 11, Generic

Therefore: Generic Bus and Interconnect Error

Here you see VMkernel is pretty good at decoding the MCEs by itself, but it can also be very useful to see for yourself what the real cause was if your error decode is missing.

Stress Testing an ESXi Host with Windows Server VMs

When you need to stress test a certain component inside your ESXi to reproduce a system crash / Machine Check Error occurrence, it is possible to make your own Stress Test using a Windows Server 2008 R2 (or higher) machines. Let’s take a look on how you design and then run a stress test. In this article I’ll be focused on making a memory stress test scenario on one ESXi host.

UPDATE: I have published another CPU Stress Testing article including Machine Check Error debugging walkthrough using a Windows 2012 VM. Check it out 🙂

First, you need to determine how to split the VMs between physical NUMA nodes on the ESXi host if you want to stress a particular node – this was my case. Our model system that has undergone a stress test is a Dual 8-Core Xeon with 192 GB RAM. The Dual-processor architecture with a Xeon CPU means that there are 2 NUMA nodes, each with 96GB RAM. Therefore, I created two VMs running Windows Server 2008 R2 Enterprise to be able to map 1/2 of the NUMA node’s memory (48 GB) to each of them. Each VM had 4 vCPUs assigned to comply with 1/2 of the node’s core count (not counting hyperthreading). Also it is mandatory to disable the swap file – we only want to fill the memory, not produce any IO on the array.

I have used the TestLimit 64-bit edition, a tool developed by Microsoft’s SysInternals (they make really awesome tools!) – just scroll down the page and search for TestLimit. The next thing you will need is the PsExec utility to run the TestLimit as a SYSTEM account – that will allow the TestLimit to fill and touch the memory. Once you have these two utilities downloaded on the stress testing VM, a little PowerShell magic comes to play:

RunStressTest.ps1

# Loops indefinitely
while ($true) {
# Start TestLimit that fills up all available physical memory and touches it afterwards
psexec -sid .\testlimit64.exe –d
# Sleep so that the memory gets filled, this needs to be finetuned to each individual machine
# If touching different NUMA node than is closest to pCPU the –s value will need to increase
Start-Sleep -s 11
# After the memory is full, find the TestLimit process ID and kill it
$killPID = (Get-Process | where {$_.name -like "*testlimit*"}).Id
Stop-Process $killPID –Force
# Sleep so that the Windows Kernel cleans up the freed memory so that the TestLimit can start again
# The memory needs to be cleaned completely before another TestLimit can start successfully.
Start-Sleep -s 9
}

This will invoke the TestLimit via PsExec and tell it to fill and subsequently touch all available RAM. The timeout values were custom-tailored to kill the process after the memory had been filled, and a subsequent sleep command to allow for the RAM to be scrubbed by the Windows Kernel, Since our aim is to crash the ESXi host or invoke the Machine Check Errors, the script executes TestLimit ad infinitum.

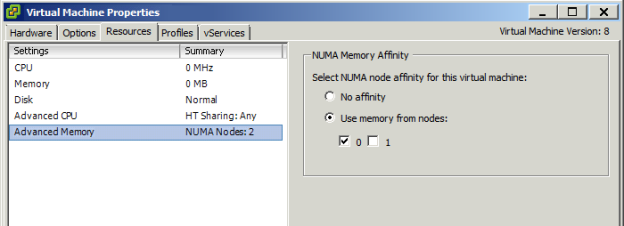
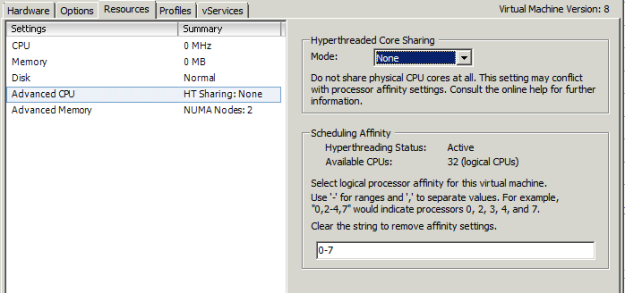
A few finishing touches had to be applied in vCenter – assigning only memory from the 1st NUMA Node (logically the 0th), and binding the virtual CPUs to Physical CPU 1 – separated between 16 logical CPUs, cores 0-15. Therefore I applied logical CPUs 0-7 for the 1st VM and 8-15 for the 2nd VM. Also I have disabled any core sharing for the running VMs so that the VMkernel CPU Scheduler left them running where they started.

image001

image007

I have cloned this prepared VM and started the stress test on both VMs simultaneously.

image003

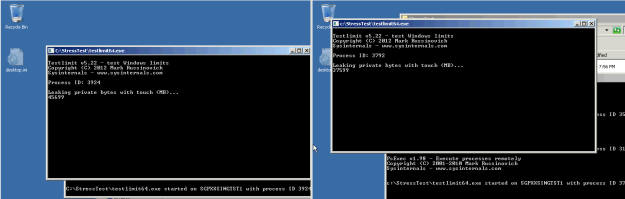
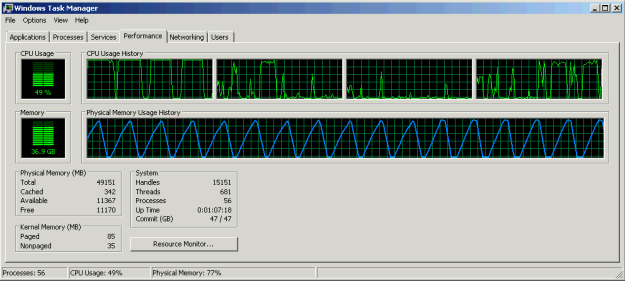
This is how the test ran on its own NUMA node:
numa-changedtoownnode

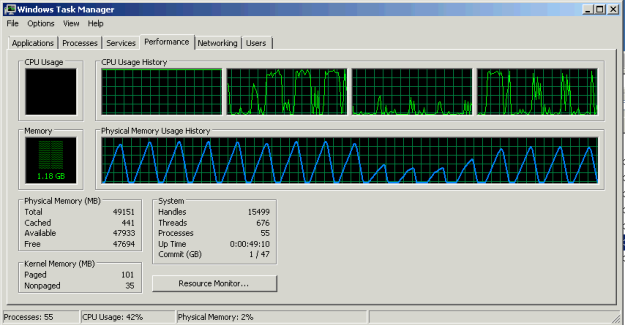
And this is how it looked after you have instructed the first CPU to touch the second CPU’s memory (you can do this in realtime). Notice the drop in memory filling rate for the first 5 runs and then the peak being lower than when accessing the processor’s own memory – here you can see the penalty to memory access across nodes.

numa-changed

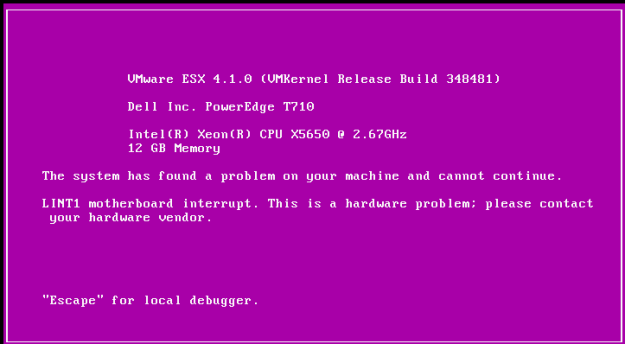
The ESXi host then crashed within 10 minutes of running this stress test. It crashed even faster when the 2nd Physical CPU touched the 1st CPUs memory – and reporting MCE errors as well in both cases. This made me 90% sure that the faulty component was memory and eventually it turned out that I was right.

On the same machine you could have Stress Tested  the physical CPU as well, using a very handy IntelBurnTest Utility on each VM with affinity set.

If you’ve got any other custom stress tests devised, I’d be happy to hear in the comments below.