Category Archives: ESXi / vSphere

Stress Testing an ESXi Host – CPU and MCE Debugging

I have needed to stress test a component inside a physical server – this time it was CPU and I’d like to share my method here. I have done a Memory Stress Test using a Windows VM in a previous article. I will be using a Windows VM again, but this time it will be Windows  Server 2012 Standard Edition that can handle up to 4TB Memory and up to 64 Sockets containing 640 logical processors – a very nice bump from Windows Server 2008 R2 Standard that had a Compute configuration maximum of 4 sockets and 32 GB RAM.

The host has crashed several times into a PSOD with Uncorrectable Machine Check Errors. From the start I had a hunch that the second Physical CPU or a System Board are faulty – but these were replaced already and the host has crashed yet again. I have taken a closer look at the matter and went to stress thest this ill host’s CPUs. Continue reading

PSOD caused by LINT1 Motherboard Interrupt

One night we had a situation on our remote site that was running ESX 4.1.0 on a DELL PowerEdge T710 Server. It went to PSOD and then the RAID controller stated that it was unable  to boot. The screen captures we got were:

purple%20screen

And after a reboot, an unwelcoming screen was shown:

Fortunately, after another reboot the system booted just fine, however it was pretty obvious that the hardware itself was in a pretty unstable state. On iDRAC, we have discovered that we got a critical warning on a component (unfortunately it was late at night and I didn’t think about screenshotting that) with Bus IDs 03:0:0. Listing components via lspci revealed that the following component was sitting on the given ID:

03:00.0 RAID bus controller: LSI Logic / Symbios Logic MegaRAID SAS GEN2 Controller (rev 05)

 Even if it was straightforward from the get-go which component might have been failing, it was double-confirmed by the very useful lspci command.

1GbE Intel NIC Throttled to 100Mbit By SmartSpeed

We had a case on one of our ESXi hosts equipped with an Intel Corporation 82571EB Gigabit Ethernet Controller – although it was 1Gbit in speed, we were unable to achieve autonegotiation higher than 100 Mbit. When setting it manually to 1Gbit, the NIC disconnected itself from the network. Every other setting worked – 10 Mbit and 100Mbit both half and full duplex. We tried investigating with our Network Team, forcing 1Gbit on switch and that has also brought the NIC down.

I delved deeper into this issue and observed the VMkernel log via tail -f when I have forcibly disconnected the NIC and reconnected it again via esxcli. One line appeared that caught my attention:

vmnic6 NIC Link is Up 100 Mbps Full Duplex, Flow Control: None
e1000e 0000:07:00.0: vmnic6: Link Speed was downgraded by SmartSpeed
e1000e 0000:07:00.0: vmnic6: 10/100 speed: disabling TSO

I immediately caugt up on SmartSpeed and tried to find a way to disable it – that is until I have found out on many discussion threads later that SmartSpeed is an intelligent throtlling mechanism that is supposed to keep the connection running on various link speeds when an error somewhere on the link path is detected. The switches were working okay, the NIC didn’t detect any errors, so the next thing to be checked would be the cabling.

I arranged a cable check with the Data Center operators and what do you know – replacing cables for brand new ones eventually solved the issue! Sometimes the failing component causing you a headache for a good few hours can be a “mundane” piece of equipment such as patch cables.

Online ESXi Firmware and Driver Upgrade on HP Servers

When upgrading firmware and drivers on a huge amount of servers, it used to be time-consuming to perform a firmware upgrade after a reboot on each and every one of your ESXi hosts to match the standard. Not anymore – since Service Pack for ProLiant 2014.09.0, the NIC Firmware can be upgraded online as well since its 10.x version (a bump from the 3.x or 4.x versions that now share a unified firmware). A huge step forward – now all the applicable firmware can be upgraded in one go – and online! No need to wait to catch the boot menu and go through HP Smart Update Manager individually.

Here’s a step by step walkthrough:

  1. Download the HP Service Pack for ProLiant you wish to apply. You will need to have a HP account and a server under warranty linked to it in order to download the newest releases.
  2. Stage the .iso file to a server that has a good connection to all the ESXi hosts you plan to upgrade (preferrably a terminal server inside the Data Center) and unpack it to the location of your liking.
  3. Run \\spplocation\hp\swpackages\x64\hpsum_bin_x64.exe – the binary will depend on your OS flavor.
  4. The following console window will pop up, stating that the HP SUM Web Service has been launched and a default web browser will lanch on the machine, opening the address localhost:63001 and automatically logging you in by passing through your credentials. You can also connect to your terminal server from any other computer that can access its ports 63001 or 63002 (and it is more comfortable that way). I strongly suggest using Google Chrome.
    image001
  5. If you access the web interface, this is what you get.image003
  6.  Start by clicking on the drop-down arrow in the top left corner and select Baseline Libraryimage005
  7. You will need to manually initiate the inventory process for the selected baseline, so click on the already present one for the process to begin.
    image007
    After a few minutes, the inventory completes.
    image009
  8. Now we need to add our ESXi hosts, select VM hosts from the drop-down menu.image011
  9. Localhost is added automatically and unfortunately can’t be changed. Click on Add Node.image013
  10. You can either add a single node by its FQDN or a range of IP addresses separated by a dash. You need to specify the type of device you are adding and the package that is your baseline. Don’t forget to put in the root credentials else the initialization will fail.image015
  11. If you need to select specific nodes inside a range, the second entry in the “Select the type of add” has just what you need. You enter the range, and after a scan you select the nodes you desire. Shift+Click and CTRL+Click work here like a charm.image017
  12. After you have added the nodes via the “Node Range” method, select the baseline to apply to them and enter the root credentials. image019
  13. When you were successful and the hosts were added, you can select multiple hosts by shift+click or ctrl+click and the right frame will change to multiple selection operation.image021
  14. Here you will need to select the baseline again by clicking on Select Baselinesimage023
  15. Select the SPP and click on Add
    image025
  16. Back in the multi-select frame you enter root credentials in order to scan the hostsimage027
  17. You will see the inventarization progressimage029
  18. Once the SUM evaluates an update is needed, input the root credentials again and Deploy the components.image031image033
  19. You have reached the familiar deploy screen where you choose the components to upgrade. When you choose Deploy, it will initialize and you will see a gray wheel spinning beside the chosen hosts.image035

When the deployment is complete, you will have a green light next to your hosts you applied updates to, and the updates will be applied on the next reboot – which is ideal for combination with VMware Update Manager to apply patches & firmware in one take.

PSOD Caused by a Machine Check Error (MCE)

Today I’d like to present to you an ESXi host crash we had in our environment tha was due to a hardware failure. This time, we were “lucky” enough to capture its PSOD. In earlier article about Machine Check Errors, I was talking about what exactly do they mean and how to debug them. Also, most of the time, when these are correctable Machine Check Errors, the host only reboots itself without leaving any trace as of why. That I have investigated by determining faulty memory after running a custom memory stress test on an ESXi host.

The Uncorrectable Machine Check Exception presented below is caused by “Other TransBus Generic Error” – this could have been related either to a CPU, or pathways on the motherboard… or both. Most of VMkernel dumps was pointing out to 2nd Physical CPU, but there were some occurrences on 1st CPU as well. Even the AHS log from the HP blade server was corrupted each time I tried to send it to a technician. Therefore they took action and replaced both the motherboard and CPUs. Since then there were no more trouble with this host.

PSOD due to Uncorrectable MCE on CPU

Manual Debugging:

For those of you who are interested – the MCE codes reported were:

In iLO: FA001E8000020E0F
in vmkernel.log: c800008000310e0f ; 8800004000310e0f

Now, if we decode the message we got from iLO manually (so that we have another source of MCE to decode from):

1 1 1 1 1 0 1 0 0 00 0000000011110100 0 0000 0000000000000010 0000 1110 0000 1111

UC 1
PCC 1
S 0
AR 0

Signaling:
Uncorrected error (UC). RESET THE SYSTEM

Examples? None found.

Compound error code found: Bus and Interconnect Errors.

BUS LL PP RRRR II T
BUS{11}_{11}_{0000}_{11}_{0}_ERR

Level: 11, generic
Request: 0000, Generic

Bus & Interconnect mnemonics:
Participation: 11, Generic

Therefore: Generic Bus and Interconnect Error

Here you see VMkernel is pretty good at decoding the MCEs by itself, but it can also be very useful to see for yourself what the real cause was if your error decode is missing.

Host IPMI Event Status Alarm PowerCLI Fix

Sometimes we are affected by a (supposedly firmware) bug that rarely affects our ESXi hosts in vCenter. This happens mainly on HP BL460c blade servers. You will get an alarm with IPMI Event Log Status, Other Hardware Objects, or Hardware Temperature status, but everything will appear okay on the Hardware Status screen and the IPMI log will be clear (or show you that 65535 are present when they aren’t). The gathered information has  pinpointed me towards resetting the CIM Service and Hardware Monitoring agents.

What this handy PowerCLI Script does is basically everything described above, but without tne hassle of connecting to each host manually – it’s a bit modular so take a look on the code first if you understand the mnemonics, if not just run it, enter your vCenter and VM name (don’t forget to see the $hosts value – it should contain your domain’t name!) and wait for a moment.

Write-Host "Reset sensors, refresh HW data & their views on an ESXi host" `n -ForegroundColor Green

<# Uncomment this to enable connection to vCenters defined in a text file
# 

$vcenterlist = Get-Content .\vcenters.txt

ForEach ($vcenter in $vcenterlist) {
Define vCenter
Write-Host `n"Connecting to vCenter $vcenter"

# Connect to vCenter
Connect-VIServer $vcenter | Out-Null
}
#>

# Define a blank array for the hosts
$hosts = @()

# input checking loop to check if $vcenter is null or not.
if ($vcenterlist -eq $null) {
do  {

[Boolean]$match = $false
$vcenter = Read-Host "Define a vCenter where the host is located"
$vcenter.Replace(' ','')
if ($vcenter -notlike "") { $match = $true }

Else {
Write-Host "The value must not be null. Try again or CTRL+C to break."`n -ForegroundColor Red
$match = $false
}

} Until ($match -eq $true)
}

# ESXi host definition
$input = Read-Host "Enter a name of ESXi host where you want to reset the HW sensors"
# Generate FQDN and store into an Array
$hosts += "$input`.yourdomain.lab"

# Connect to vCenter
Write-Host `n "Connecting to vCenter $vcenter`..."
ForEach ($vcenter in $vcenterlist) {
Connect-VIServer $vcenter | Out-Null
}

# The VMhost needs to be stored into an array with Get-VMhost for further processing
$vmhosts = Get-VMHost -Name $hosts

# Get all vmhosts for the connected vCenter sessions
#$vmhosts = Get-VMHost

ForEach ($vmhost in $vmhosts)
{
	Try
	{
		#initialize calls for refreshing hardware status..
		Write-Host "Restarting CIM Server service on $vmhost"
		Get-VMHost $vmhost | Get-VMHostService | Where { $_.Key -eq “sfcbd-watchdog” } | Restart-VMHostService -Confirm:$false | Out-Null
		Start-Sleep -Seconds 15

		Write-Host "Starting to refresh HW info on $vmhost (this can take a while)"

		# Define variables for system calls
		$hv = Get-View $vmhost
		$hss = get-view $hv.ConfigManager.HealthStatusSystem

		Write-Host "Resetting HW Sensors..."
		$hss.ResetSystemHealthInfo()
		Start-Sleep -Seconds 15

		Write-Host "Refreshing Data..."
		$hss.RefreshHealthStatusSystem()
		Start-Sleep -Seconds 15

		Write-Host "Refreshing Data View..."
		$hss.UpdateViewData()
		Start-Sleep -Seconds 15
	}
	Catch [System.Exception]
	{
		Write-Host "There was an error while trying to refresh the hardware data." `n `
					"Please check the ESXi host's Hardware Status Tab." -ForegroundColor 'Red'
	}
	Finally
	{
		Write-Host "Disconnecting from the vCenter Server..."
		Disconnect-VIServer $vcenter -Confirm:$false
		Write-Host "Done processing $vmhost." -ForegroundColor Green
	}
}

I Hope it has alleviated at least one occurrence of this bug 🙂

Debugging Machine Check Errors (MCEs)

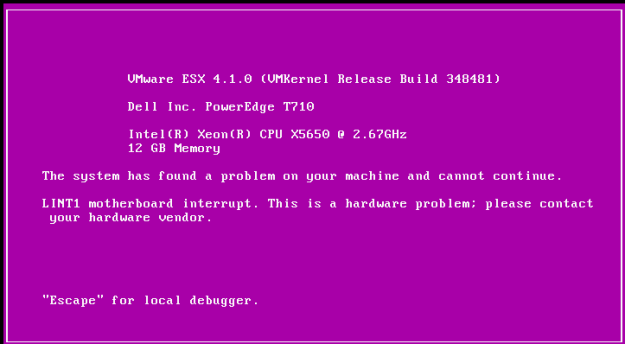
There comes a time where a hardware failure on one of your ESXi hosts is imminent. You can recognize that when the host crashes while under a certain CPU or Memory intensive load – or even at random. Most of the times without throwing a Purple Screen of Death so you can at least have a notion about what went wrong. There is a VMware KB Article 1005184 concerning this issue, and it has been updated significantly since I have started to take interest in these errors.

UPDATE: I have published a new CPU Stress Test & Machine Check Error debugging article – check it out if you’d like to learn more.

If you are “lucky”, you can see and decode yourself what preceded the crash. This is because both AMD and Intel CPUs have implemented something by the name of Memory Check Architecture. This architecture enables the CPUs to intelligently determine a fault that happens anywhere on the data transfer path during processor operation. This can capture Memory operation errors, CPU Bus interconnect errors, cache errors, and much more. How to determine what has been causing your system to fail? Read on.

You will need to browse to Intel’s website hosting the Intel® 64 and IA-32 Architectures Software Developer Manuals. There, download a manual named “Intel 64 and IA-32 Architectures Software Developer’s Manual Combined Volumes 3A, 3B, and 3C: System Programming Guide”. I highly recommend printing it, because you will be doing some back-and-forth seeking.

Now, to get list of possible Machine Check Errors captured by the VMkernel, run the following in your SSH session with superuser privileges:

cd /var/log;grep MCE vmkernel.log

this will output something similar to this:

Memory Controller Errors


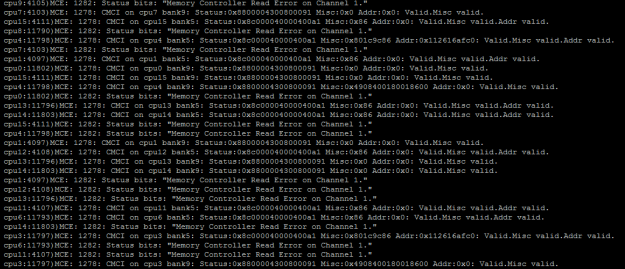
Most of the times, the VMkernel decodes these messages for you – on this image you see that  there are plenty of Memory Controller Read Errors. You can see more closely where the problem originates from:

  • CMCI: This stands for Corrected Machine Check Interrupt – an error was captured but it was corrected and the VMkernel can keep on running. If this were to be an uncorrectalbe error, the ESXi host would crash.
  • Logical CPU number where the MCE was detected: This particular host had Dual 8-Core Intel Xeon Processors with HyperThreading enabled. For all other occurrences of this MCE, the cpu# was alternating between 0-15 this means the fault was always detected on the first cpu.
  • Memory Controller Read/Write/Scrubbing error on Channel x: Means that the error was captured on a certain channel of the physical processor’s NUMA node. Since there is a quad-channel memory controller used for this particular CPU, the channels would range from 0-3. This error is reported on Channel 1, which means one or both of the memory sticks on that channel are faulty.

You can turn on your hardware vendor’s support indicating that a component might be failing, or nudge them towards a certain component – but always make sure there is a support representative from VMware to back your findings up. Some companies don’t “trust” these error messages and if their diagnostics software doesn’t reveal the fault (in majority of cases, they don’t) and their engineers do not know about Memory Check Architecture – how it is implemented and whether to trust the error codes (they should). This is where a leverage from your VMware support engineer comes in very handy – speaking from my experience. In the end the memory stick replacement solved the issue – how I got to it being a memory problem will be explained in an upcoming article.

If you are curious what do these hexadecimal strings mean and would like to know how to decode them manually, here’s a short walk-through (This was captured on the same host, when it had scrubbing errors)

  • You have to convert the Status string from Hexadecimal to Binary

Status:0xcc001c83000800c1 Misc:0x9084003c003c68c Addr:0x112616bc40  — Valid.Overflow.Misc valid.Addr valid.

  • Convert the Status hex value to Binary and split it according to Figure 15-6 in the manual

1 1 0 0 1 1 0 0 0 00 0000000011100000 0 0011 0000000000001000 0000 0000 1100 0001

  •  Note down the last bits:

VAL — MCi_STATUS register valid (63) = TRUE
OVER — Error overflow (62) – TRUE , corresponds with Valid.Overflow.Misc valid.Addr valid
UC — Uncorrected error (61) – FALSE
EN — Error reporting enabled (60) – FALSE
PCC – FALSE
0000000011100000 how many errors were corrected = 224 errors

  • Note the first 16 bits

MSCOD: 0000 0000 1100 0001

  •  Compare the code bits according to table 15-6

UC = FALSE and PCC FALSE, therefore: ECC in caches and memory

  •  Decode the compound Code and compare it to the examples found in table 15.9.2

Therefore, the compound error code is “Memory Controller Errors”

MMM = 100
CCCC = 0001
{100}_channel{0001}_ERR

  •  From there, decode this according to table 15-13:

Memory Controller Scrubbing Error on Channel 1

Pretty easy, right? Let me give you another MCE example – This was captured from an ESXi host that eventually had 2 faulty memory modules, but was only acknowledged by the manufacturer when they had exceeded the Corrected ECC threshold. BIOS marked them as inactive after running memtest 86+ on them for 20 hours since that error was detected – the integrated diagnostics utility revealed nothing. I’ll provide a quicker debug here:

 1 1 0 0 1 1 0 0 0 00 0000000000001110 0 0000 0000000000000001 0000 0000 1001 1111

  •  VAL – MCi_STATUS register Valid – TRUE
  • OVER – Error overflow – TRUE
  • UC – Uncorrected Error FALSE
  • EN – Error reporting enabled FALSE
  • MISCV TRUE
  • ADDRV TRUE
  • PCC FALSE
  • S FALSE
  • THRESHOLD – FALSE

MCE CODE: 0000 0000 1001 1111

This code relates to error in: ECC in caches and memory

After debug:
{001}_channel{1111}_ERR
Memory Read Error on an Unspecified Channel

I hope this article has shed some light for you concerning the Machine Check Error architecture. I’m open for discussion about this topic and even some MCEs you had in the comments.