There comes a time where a hardware failure on one of your ESXi hosts is imminent. You can recognize that when the host crashes while under a certain CPU or Memory intensive load – or even at random. Most of the times without throwing a Purple Screen of Death so you can at least have a notion about what went wrong. There is a VMware KB Article 1005184 concerning this issue, and it has been updated significantly since I have started to take interest in these errors.
UPDATE: I have published a new CPU Stress Test & Machine Check Error debugging article – check it out if you’d like to learn more.
If you are “lucky”, you can see and decode yourself what preceded the crash. This is because both AMD and Intel CPUs have implemented something by the name of Memory Check Architecture. This architecture enables the CPUs to intelligently determine a fault that happens anywhere on the data transfer path during processor operation. This can capture Memory operation errors, CPU Bus interconnect errors, cache errors, and much more. How to determine what has been causing your system to fail? Read on.
You will need to browse to Intel’s website hosting the Intel® 64 and IA-32 Architectures Software Developer Manuals. There, download a manual named “Intel 64 and IA-32 Architectures Software Developer’s Manual Combined Volumes 3A, 3B, and 3C: System Programming Guide”. I highly recommend printing it, because you will be doing some back-and-forth seeking.
Now, to get list of possible Machine Check Errors captured by the VMkernel, run the following in your SSH session with superuser privileges:
cd /var/log;grep MCE vmkernel.log
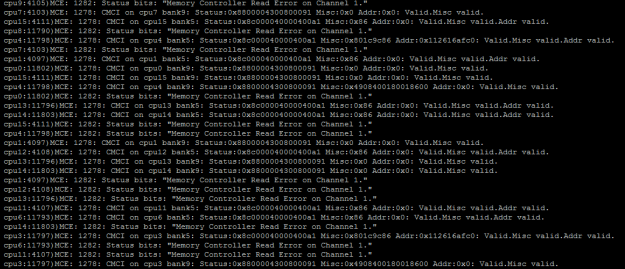
this will output something similar to this:

Most of the times, the VMkernel decodes these messages for you – on this image you see that there are plenty of Memory Controller Read Errors. You can see more closely where the problem originates from:
- CMCI: This stands for Corrected Machine Check Interrupt – an error was captured but it was corrected and the VMkernel can keep on running. If this were to be an uncorrectalbe error, the ESXi host would crash.
- Logical CPU number where the MCE was detected: This particular host had Dual 8-Core Intel Xeon Processors with HyperThreading enabled. For all other occurrences of this MCE, the cpu# was alternating between 0-15 this means the fault was always detected on the first cpu.
- Memory Controller Read/Write/Scrubbing error on Channel x: Means that the error was captured on a certain channel of the physical processor’s NUMA node. Since there is a quad-channel memory controller used for this particular CPU, the channels would range from 0-3. This error is reported on Channel 1, which means one or both of the memory sticks on that channel are faulty.
You can turn on your hardware vendor’s support indicating that a component might be failing, or nudge them towards a certain component – but always make sure there is a support representative from VMware to back your findings up. Some companies don’t “trust” these error messages and if their diagnostics software doesn’t reveal the fault (in majority of cases, they don’t) and their engineers do not know about Memory Check Architecture – how it is implemented and whether to trust the error codes (they should). This is where a leverage from your VMware support engineer comes in very handy – speaking from my experience. In the end the memory stick replacement solved the issue – how I got to it being a memory problem will be explained in an upcoming article.
If you are curious what do these hexadecimal strings mean and would like to know how to decode them manually, here’s a short walk-through (This was captured on the same host, when it had scrubbing errors)
- You have to convert the Status string from Hexadecimal to Binary
Status:0xcc001c83000800c1 Misc:0x9084003c003c68c Addr:0x112616bc40 — Valid.Overflow.Misc valid.Addr valid.
- Convert the Status hex value to Binary and split it according to Figure 15-6 in the manual
1 1 0 0 1 1 0 0 0 00 0000000011100000 0 0011 0000000000001000 0000 0000 1100 0001
VAL — MCi_STATUS register valid (63) = TRUE
OVER — Error overflow (62) – TRUE , corresponds with Valid.Overflow.Misc valid.Addr valid
UC — Uncorrected error (61) – FALSE
EN — Error reporting enabled (60) – FALSE
PCC – FALSE
0000000011100000 how many errors were corrected = 224 errors
MSCOD: 0000 0000 1100 0001
- Compare the code bits according to table 15-6
UC = FALSE and PCC FALSE, therefore: ECC in caches and memory
- Decode the compound Code and compare it to the examples found in table 15.9.2
Therefore, the compound error code is “Memory Controller Errors”
MMM = 100
CCCC = 0001
{100}_channel{0001}_ERR
- From there, decode this according to table 15-13:
Memory Controller Scrubbing Error on Channel 1
Pretty easy, right? Let me give you another MCE example – This was captured from an ESXi host that eventually had 2 faulty memory modules, but was only acknowledged by the manufacturer when they had exceeded the Corrected ECC threshold. BIOS marked them as inactive after running memtest 86+ on them for 20 hours since that error was detected – the integrated diagnostics utility revealed nothing. I’ll provide a quicker debug here:
1 1 0 0 1 1 0 0 0 00 0000000000001110 0 0000 0000000000000001 0000 0000 1001 1111
- VAL – MCi_STATUS register Valid – TRUE
- OVER – Error overflow – TRUE
- UC – Uncorrected Error FALSE
- EN – Error reporting enabled FALSE
- MISCV TRUE
- ADDRV TRUE
- PCC FALSE
- S FALSE
- THRESHOLD – FALSE
MCE CODE: 0000 0000 1001 1111
This code relates to error in: ECC in caches and memory
After debug:
{001}_channel{1111}_ERR
Memory Read Error on an Unspecified Channel
I hope this article has shed some light for you concerning the Machine Check Error architecture. I’m open for discussion about this topic and even some MCEs you had in the comments.

